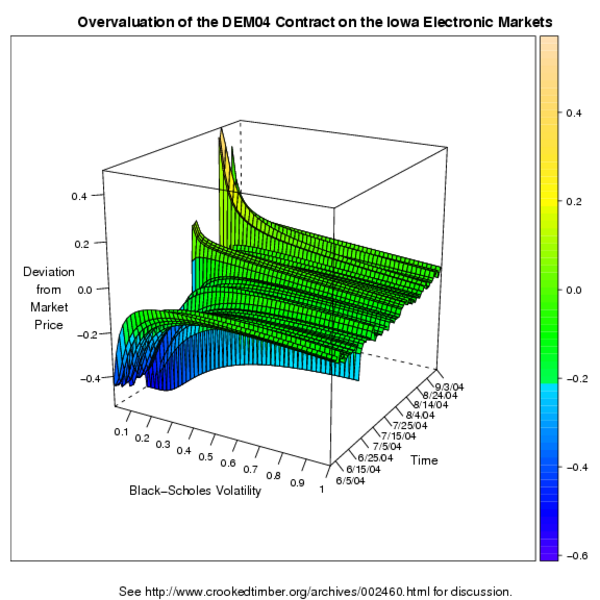
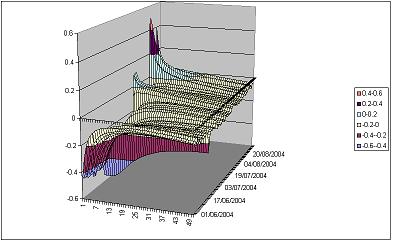
As a spin-off from Daniel’s discussion of whether the DEM04 contract is overvalued on the Iowa Electronic Markets, here’s a version of the trend surface he calculated that shows differences between the Black-Scholes valuation and the observed market price over time (you can look at it in smaller PNG format or better-quality PDF). I created it using R, the free[1] statistics package because I didn't like Excel's default effort and I hadn’t had a reason to use R’s wireframe() function before. It’s still not up to the standards of the Bill Clevelands or Ed Tuftes of this world, but it was the best I could manage on short notice. Thanks to Daniel for sending me the data, and remember that whereas I am happy to field questions about graph colors and chart widgets, technical queries about option valuation, Black-Scholes volatility fluctuations and arbitrage should still be directed to him.
fn1. As in “free to make your own mistakes.”
{ 5 comments }
Jonathan Goldberg 09.09.04 at 1:27 pm
” It’s still not up to the standards of the Bill Clevelands or Ed Tuftes of this world…”
So little is. I just read Tufte’s “The Cogitive Style of Powerpoint.” Wonderful. I wish everyone who presents using PP outpoint output had to read it first.
dsquared 09.09.04 at 1:32 pm
Well yes, I must agree, that is a bloody impressive plot.
dsquared 09.09.04 at 6:21 pm
Right, inspired by that, I have now downloaded R. Any chance of posting the R commands which created the plot?
Kieran Healy 09.09.04 at 10:07 pm
Sure, here ya go:
The code is in “surface.r”:http://www.kieranhealy.org/files/misc/surface.r and uses “this CSV data file”:http://www.kieranhealy.org/files/misc/surface.csv.
dsquared 09.09.04 at 10:13 pm
god that’s impressive. this looks like it’s going to be a ton of fun.
Comments on this entry are closed.